Python API - Weather Data
This analysis looks at what the weather is like as we approach the equator, using Python requests, APIs, and JSON traversals.
Source: Open Weather Map API »
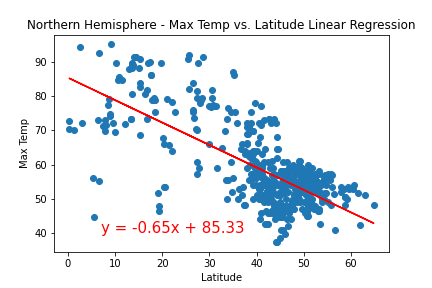
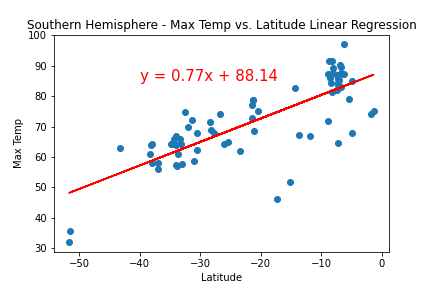
Looking at the scatter plots, the main pattern observed was for the relationship between latitude and temperature; all the highest temperature values are located in the -20 to 20 range of latitude, closest to the equator. Lower ranges of temperature readings corresponded to latitude ranges further from the equator (e.g. -40 to -20 and 20 to 40 range was colder than close to the equator, and so on).
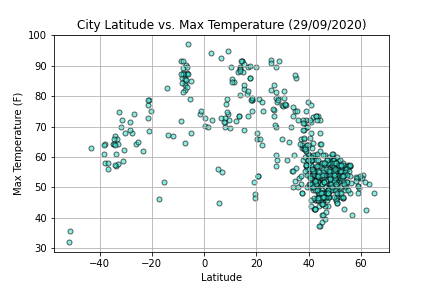
The linear regression plots and r-values (-0.70, 0.78) reflected the same trend of temperature increasing the closer to the equator we moved, and decreased the further from the equator we moved. This was true whether moving North or South from the equator.
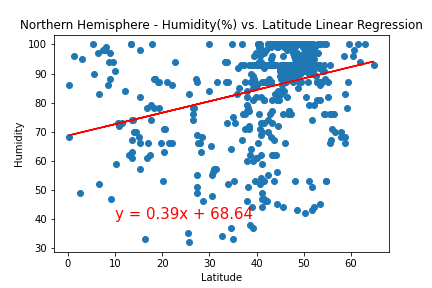
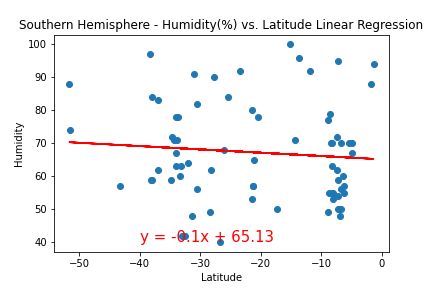
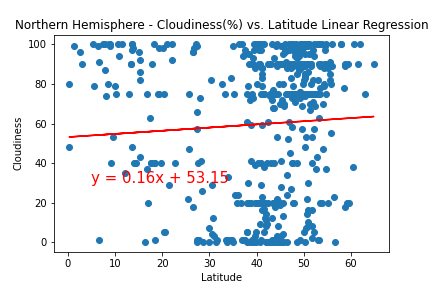
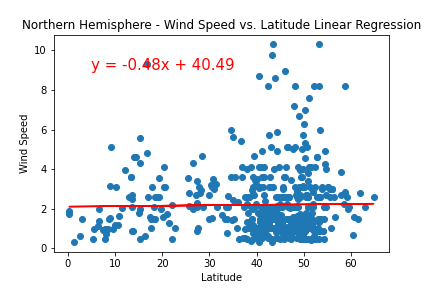
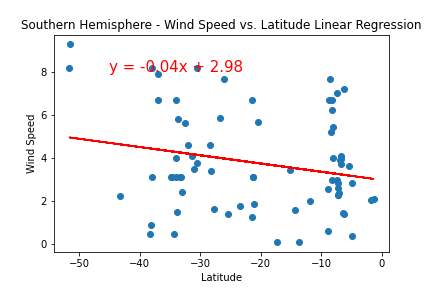
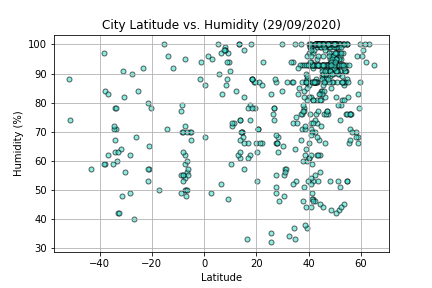
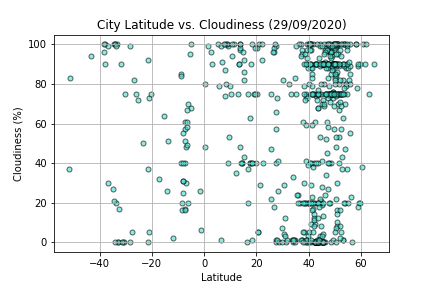
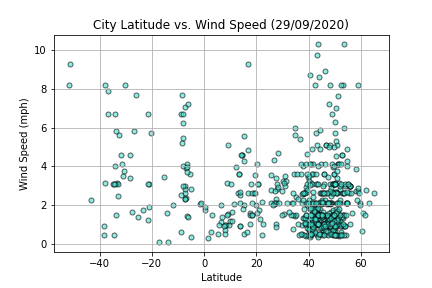
The regression lines and r-values for the remaining variable vs. Latitude plots did not indicate any meaningful trends in our sample of cities. Latitude, or distance from the equator, was not a good predictor of Humidity, Cloudiness, or Wind Speed.